
Tools that close
Find the right multiple in seconds.
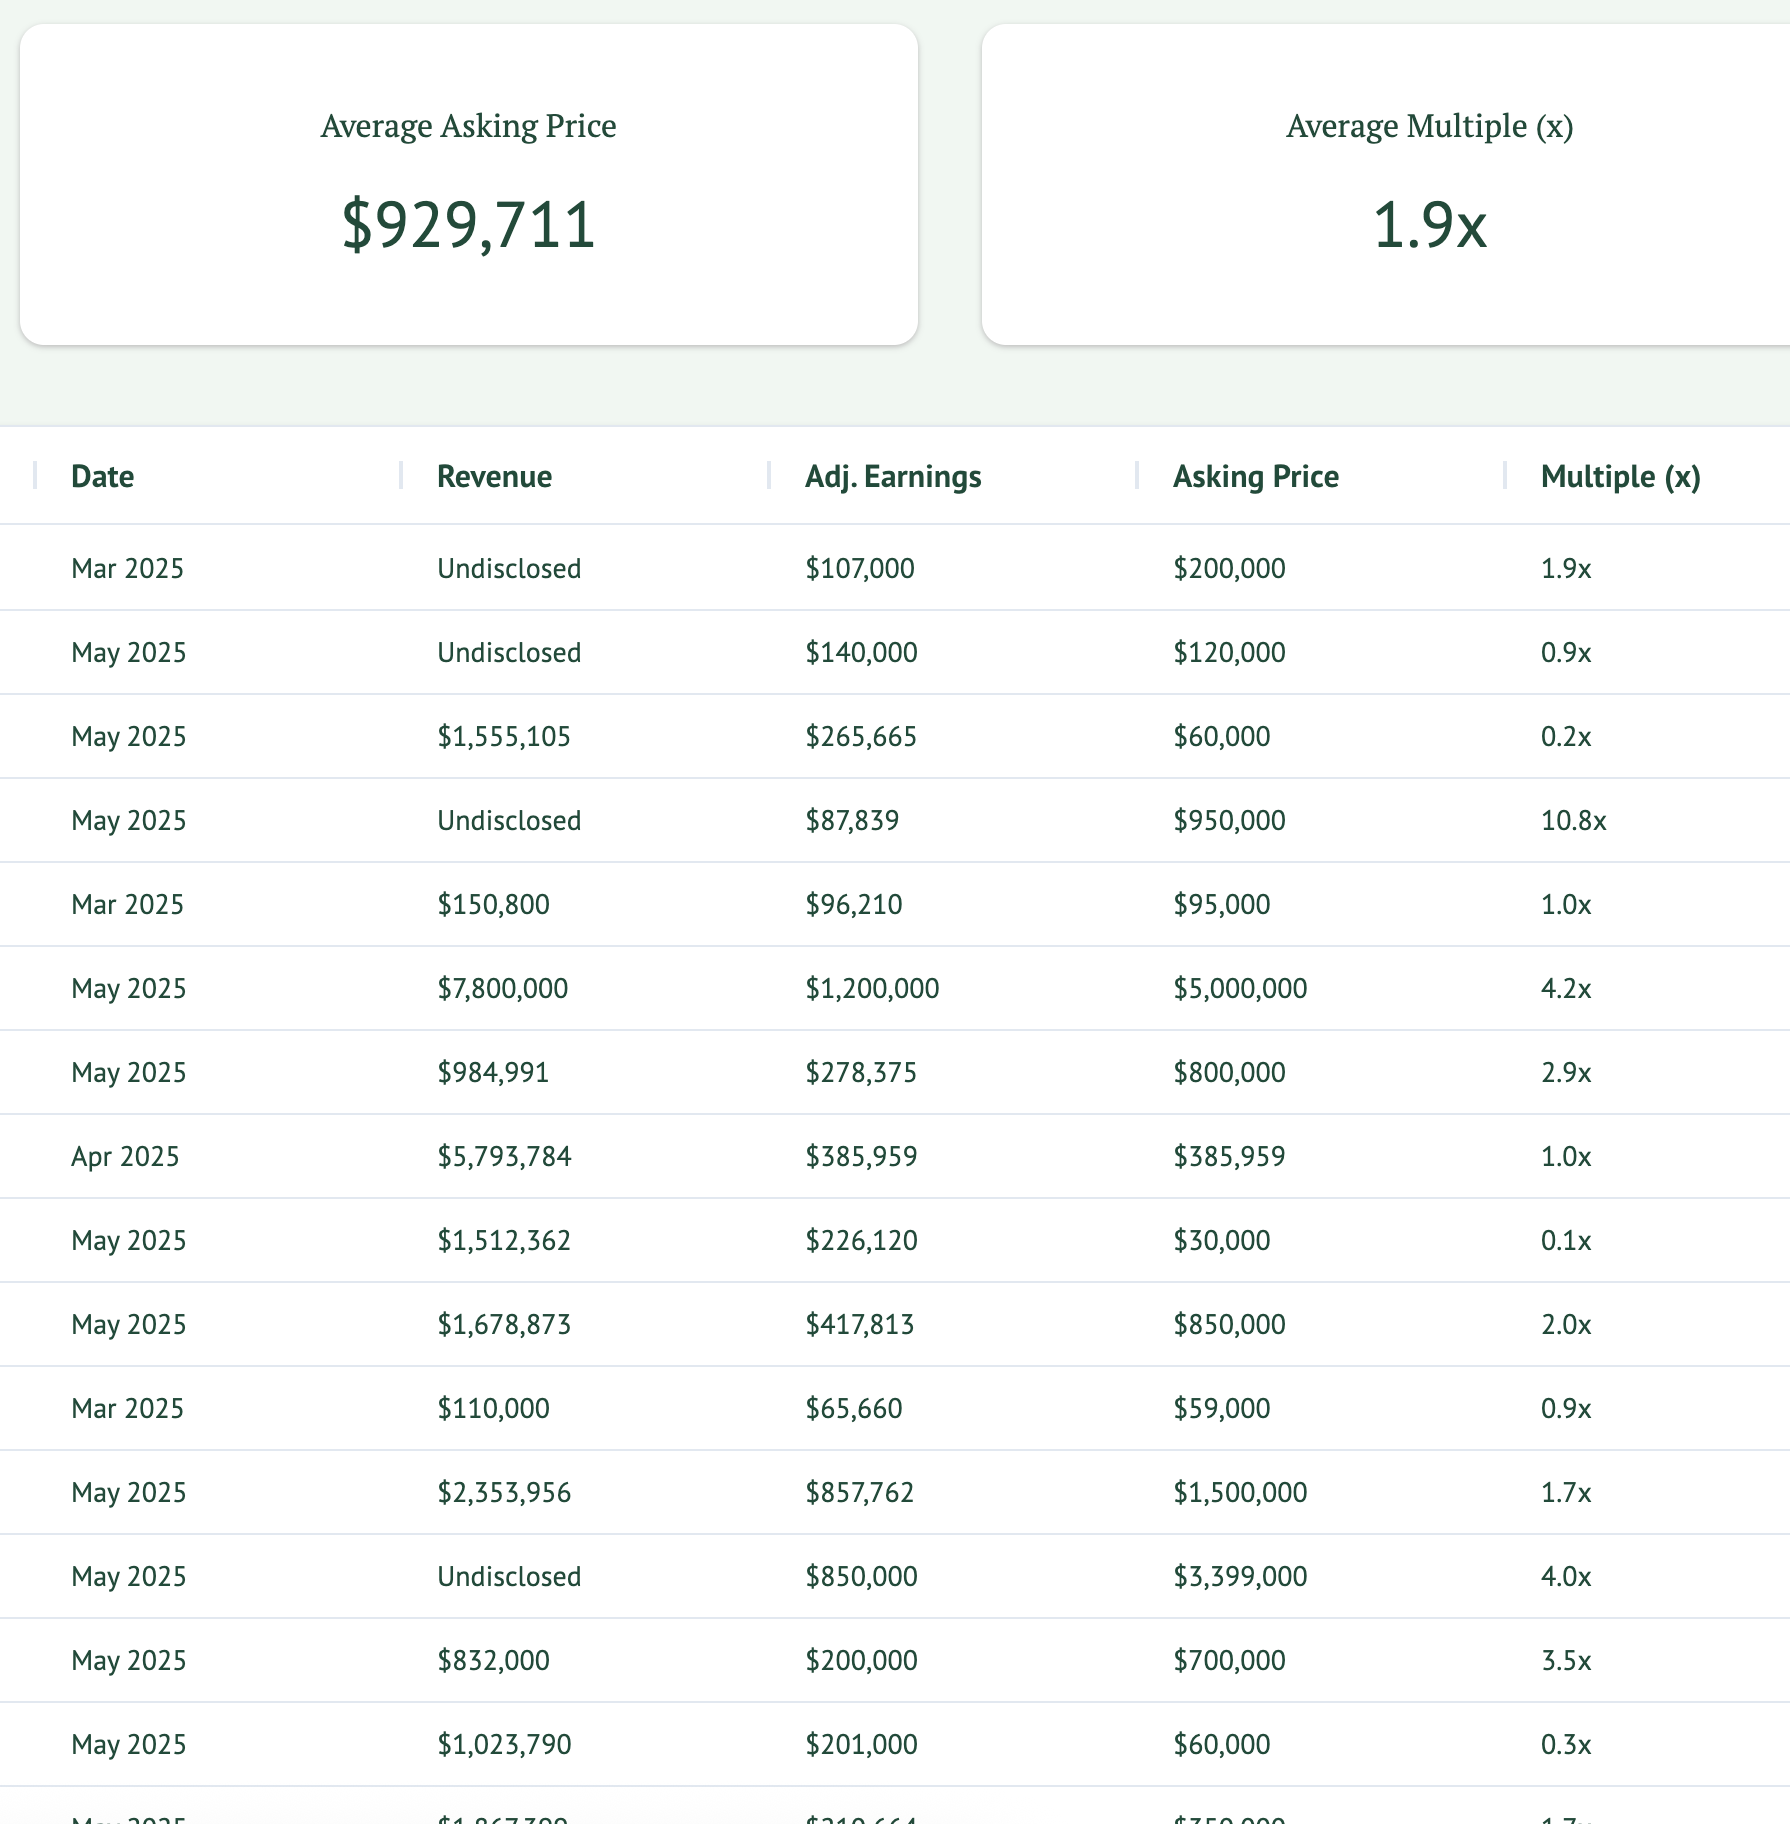
Tap into a live library of thousands of business listings multiples and instantly zero in on the precise earnings multiple for your deal.
Custom filters for industry, size and region ensure you price with confidence—no lengthy research or guesswork required.
Never miss a market shift.
Track multiples rise and fall as new businesses hit the market and economy shifts.
With fresh data at your fingertips, you can quickly re-prioritise your pipeline to focus on the hottest opportunities before anyone else.
Export instantly
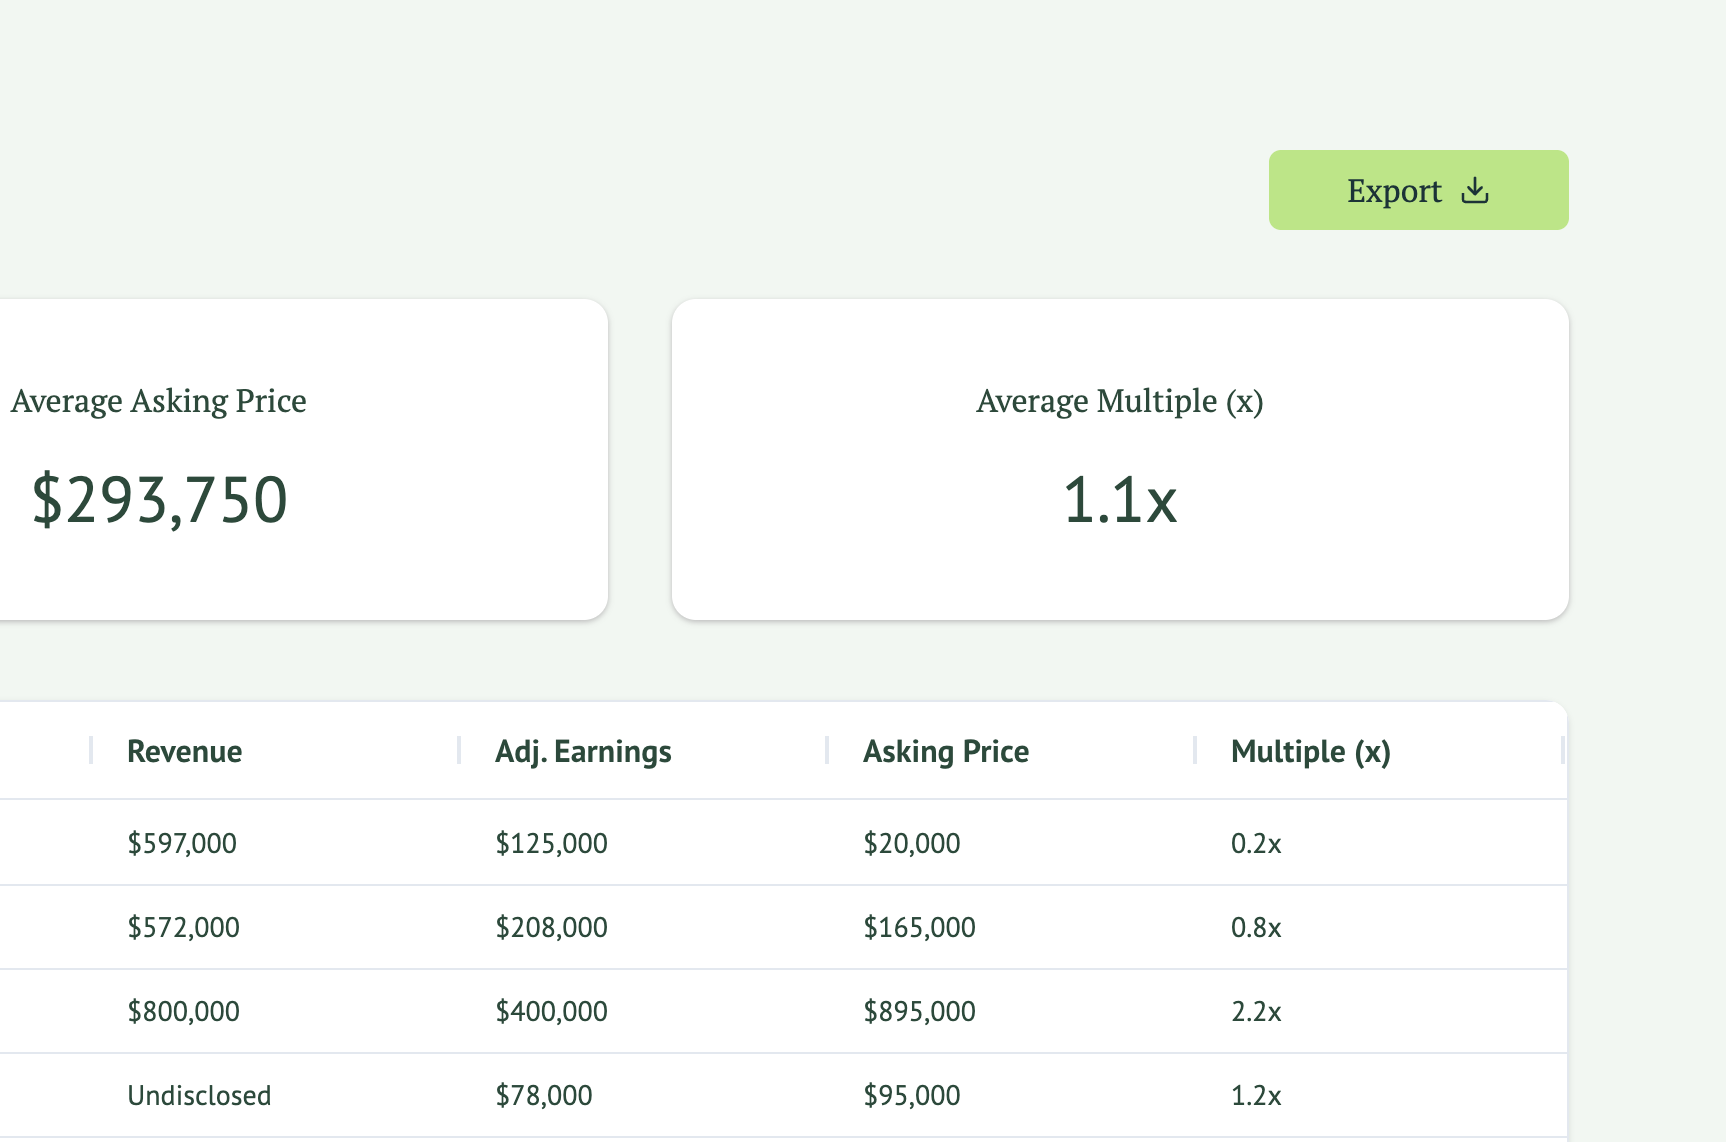
Download easy-to-use, white-label CSVs of your filtered listings and multiples—perfect for feeding into your own reports or presentations.
Comparable filters
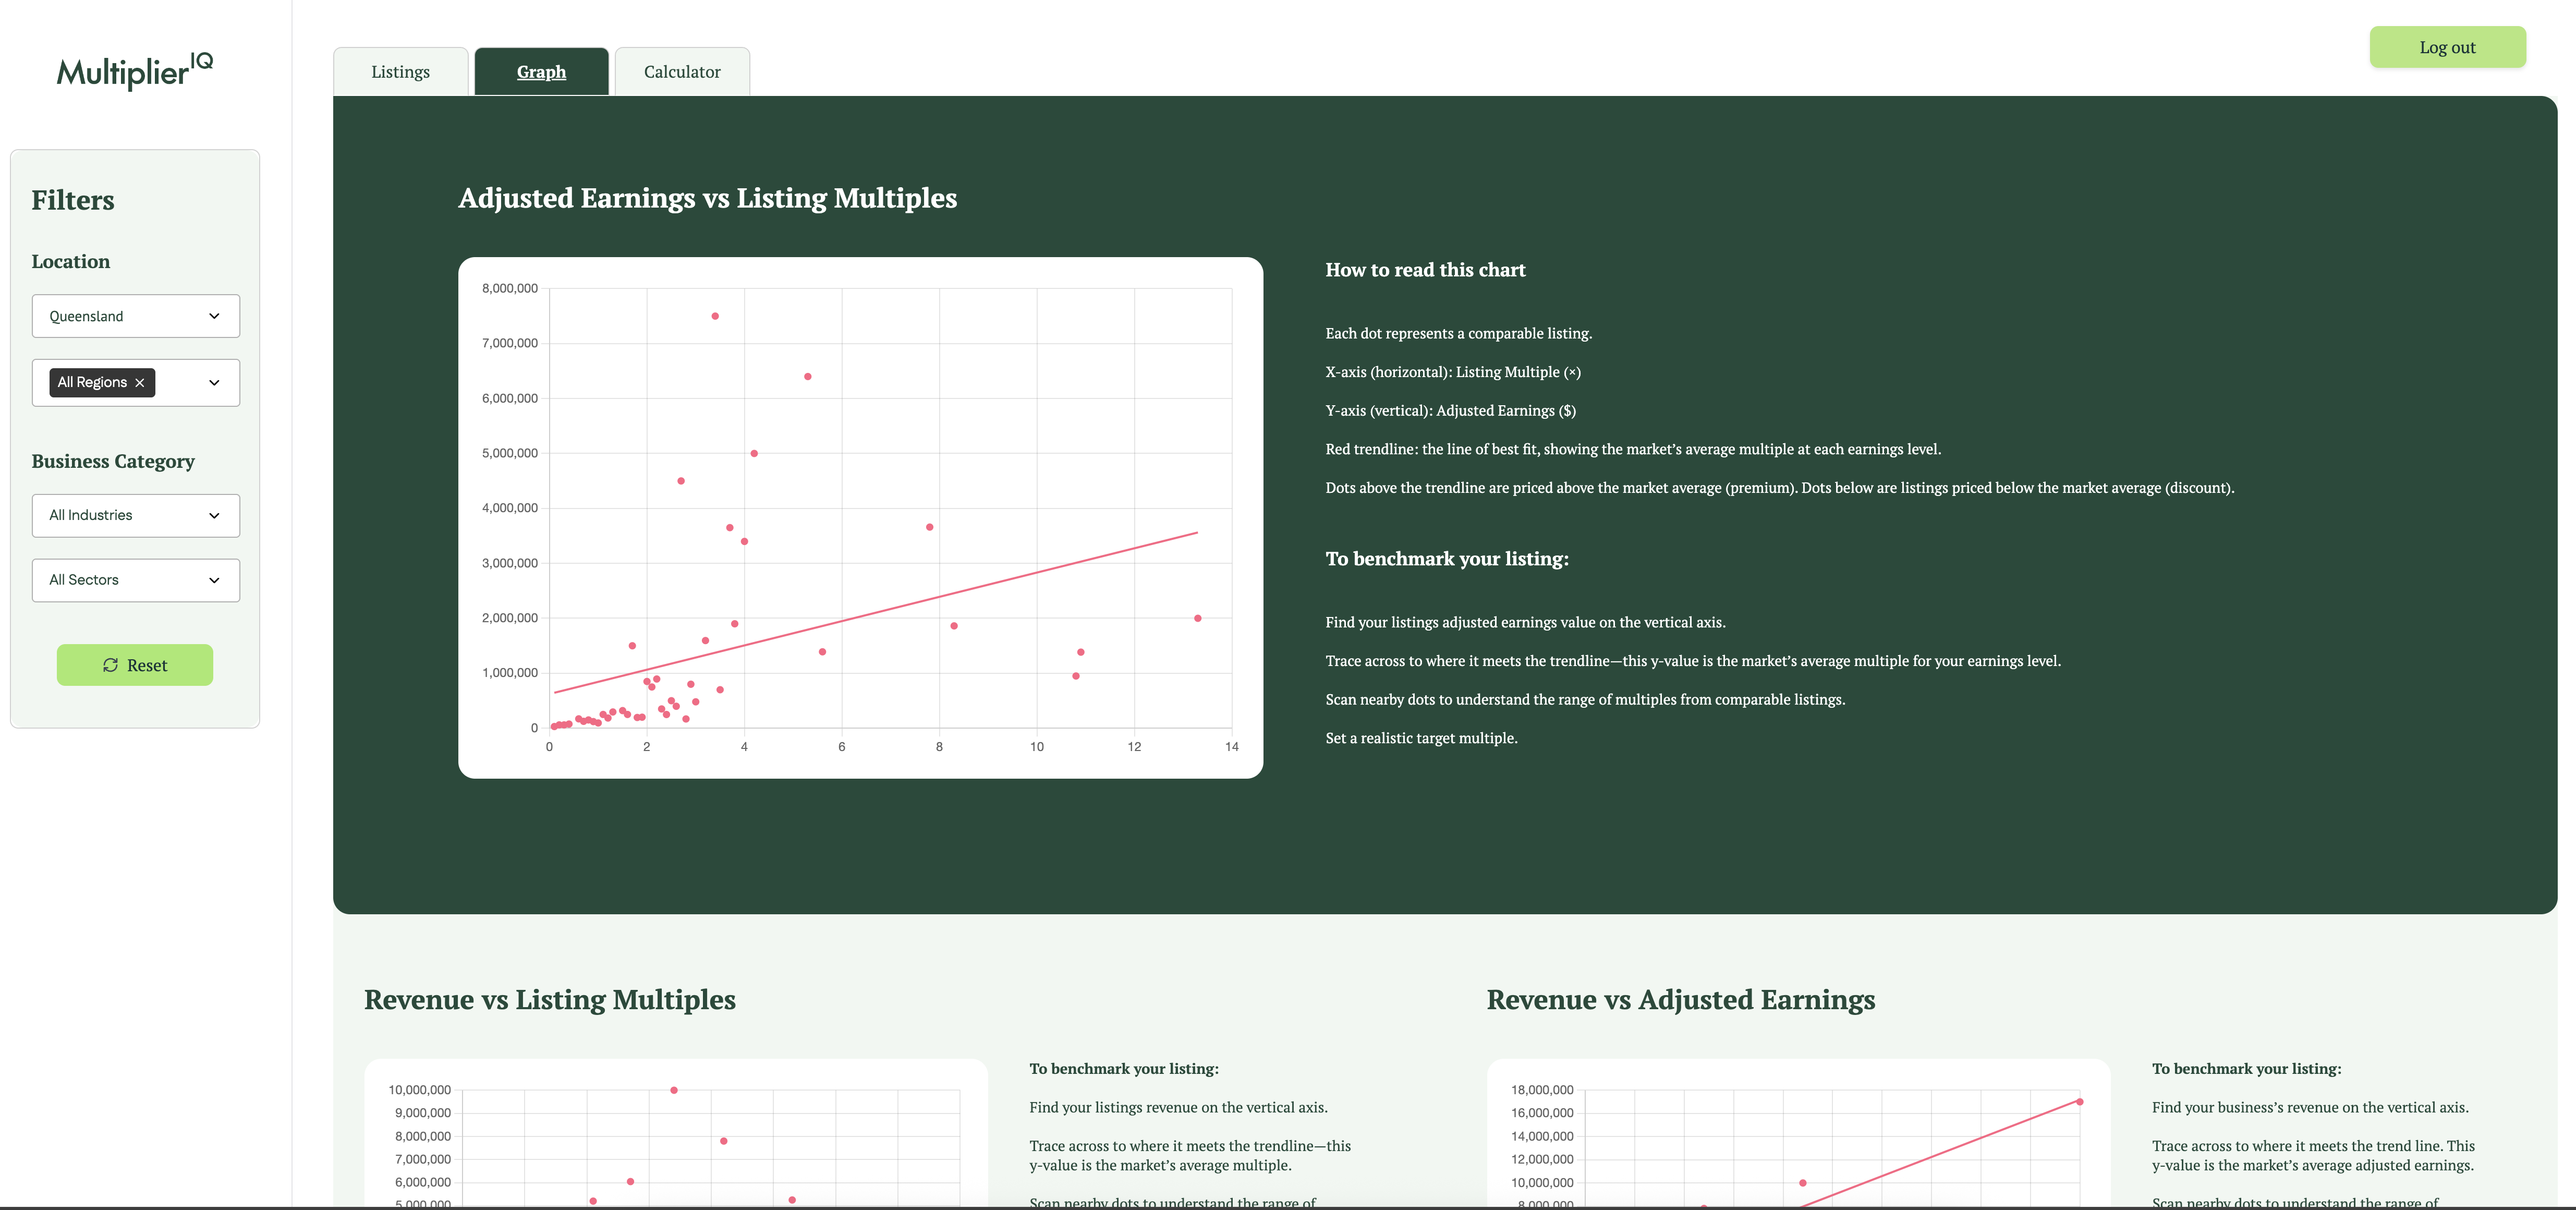
Filter thousands of listings by industry, sector, state and region.
Data-driven decisions
Confident, evidence-backed calls without the guesswork.
Close faster
Price right from day one, cut negotiation cycles and close deals faster.
Market mastery
Showcase your expertise with data that inspires client trust.

Our advantage
Other sites
Multiplier IQ
Deal data decoded
Where does your data come from?
All our multiple benchmarks are drawn from publicly available business-for-sale listings posted by brokers and business owners across Australia.
Here’s how it works:
- AI aggregates listings
We gather publicly available business-for-sale listings across Australia. - Key financials extracted
Since raw financial data is not subject to copyright protection, whenever a seller discloses their core financial metrics, our system records it and calculates the earnings multiplier. - Data anonymisation
Each listing goes through an anonymisation process that assigns a unique ID (e.g. QLD-0001) and categorises it by State, Sub-region, Industry and Sector. This record contains no seller-written copy, photos or other identifying details. - Insight delivery
You access this clean, comprehensive market dataset via our search tools, custom filters, exports and alerts—so you can benchmark and negotiate with confidence.
How often is the data updated?
We use two overlapping update cycles to keep everything fresh:
- Daily ingestion
We pull in all newly posted listings on a daily basis. - Weekly full refresh
We reprocess every state on a rolling seven-day schedule.
How is the earnings multiple calculated?
When a business-for-sale listing discloses key financial metrics - specifically the return to owner and the asking price, we can apply this simple formula:
Earnings Multiple = Asking Price ÷ Return to Owner
By running that calculation across thousands of anonymised listings, we generate a robust, market-driven benchmark of the real-world multiples brokers are currently using.
What if a listing doesn’t reveal its financials?
If a listing doesn’t publicly disclose the key financial metrics that we require, we automatically exclude it from our dataset.
We capture only the metrics sellers voluntarily share in their advertisements—we never request or access private financial statements.
While some listings won’t qualify, you can trust our benchmarks are credible, consistent and based solely on transparent market disclosures.
What's the difference between listing and sales comparative data?
Our platform reports listing multiples, which are based on the initial asking price ÷ return to owner (pre-negotiation).
Sales multiples, by contrast, use the final sale price ÷ return to owner (post-negotiation).
In practice, the sales price will land below the listing price, typically by 5–15 percent, though the exact gap varies by business size, industry and market conditions.
Example
- Listing multiple (pre-negotiation):
Asking price $500 000 ÷ return to owner $200 000 = 2.50× - Sales multiple (post-negotiation):
Final sale $450 000 ÷ return to owner $200 000 = 2.25× (10% lower of the initial asking price)
Both metrics have their place:
- Listing multiples show the market’s current expectations and includes the broker’s built-in negotiation margin—ideal for setting a competitive, defensible asking price.
- Sales multiples reveal the multiple that a buyer ultimately pays, but will need an additional buffer added to it to set an asking price.
Because our data is drawn from thousands of live listings across every region and industry, you’ll get a reliable, market-based benchmark for your asking prices. Just be sure to explain to sellers that these multiples are pre-negotiation guides—not guaranteed sale results.
Are you affiliated with anyone?
No — we’re an independent data platform, not a brokerage or marketplace:
- We do not broker, sell, represent or endorse any individual business for sale.
- We have no affiliation with any listing websites or the brokers who publish those listings.
- We simply aggregate, anonymise and analyse publicly available data to deliver unbiased market benchmarks.